Category: Guides

  • Rent vs Buy: Which Is Cheaper for You?

    Rent vs Buy: Which Is Cheaper for You?

    Rent vs Buy: Which Is Cheaper for You?

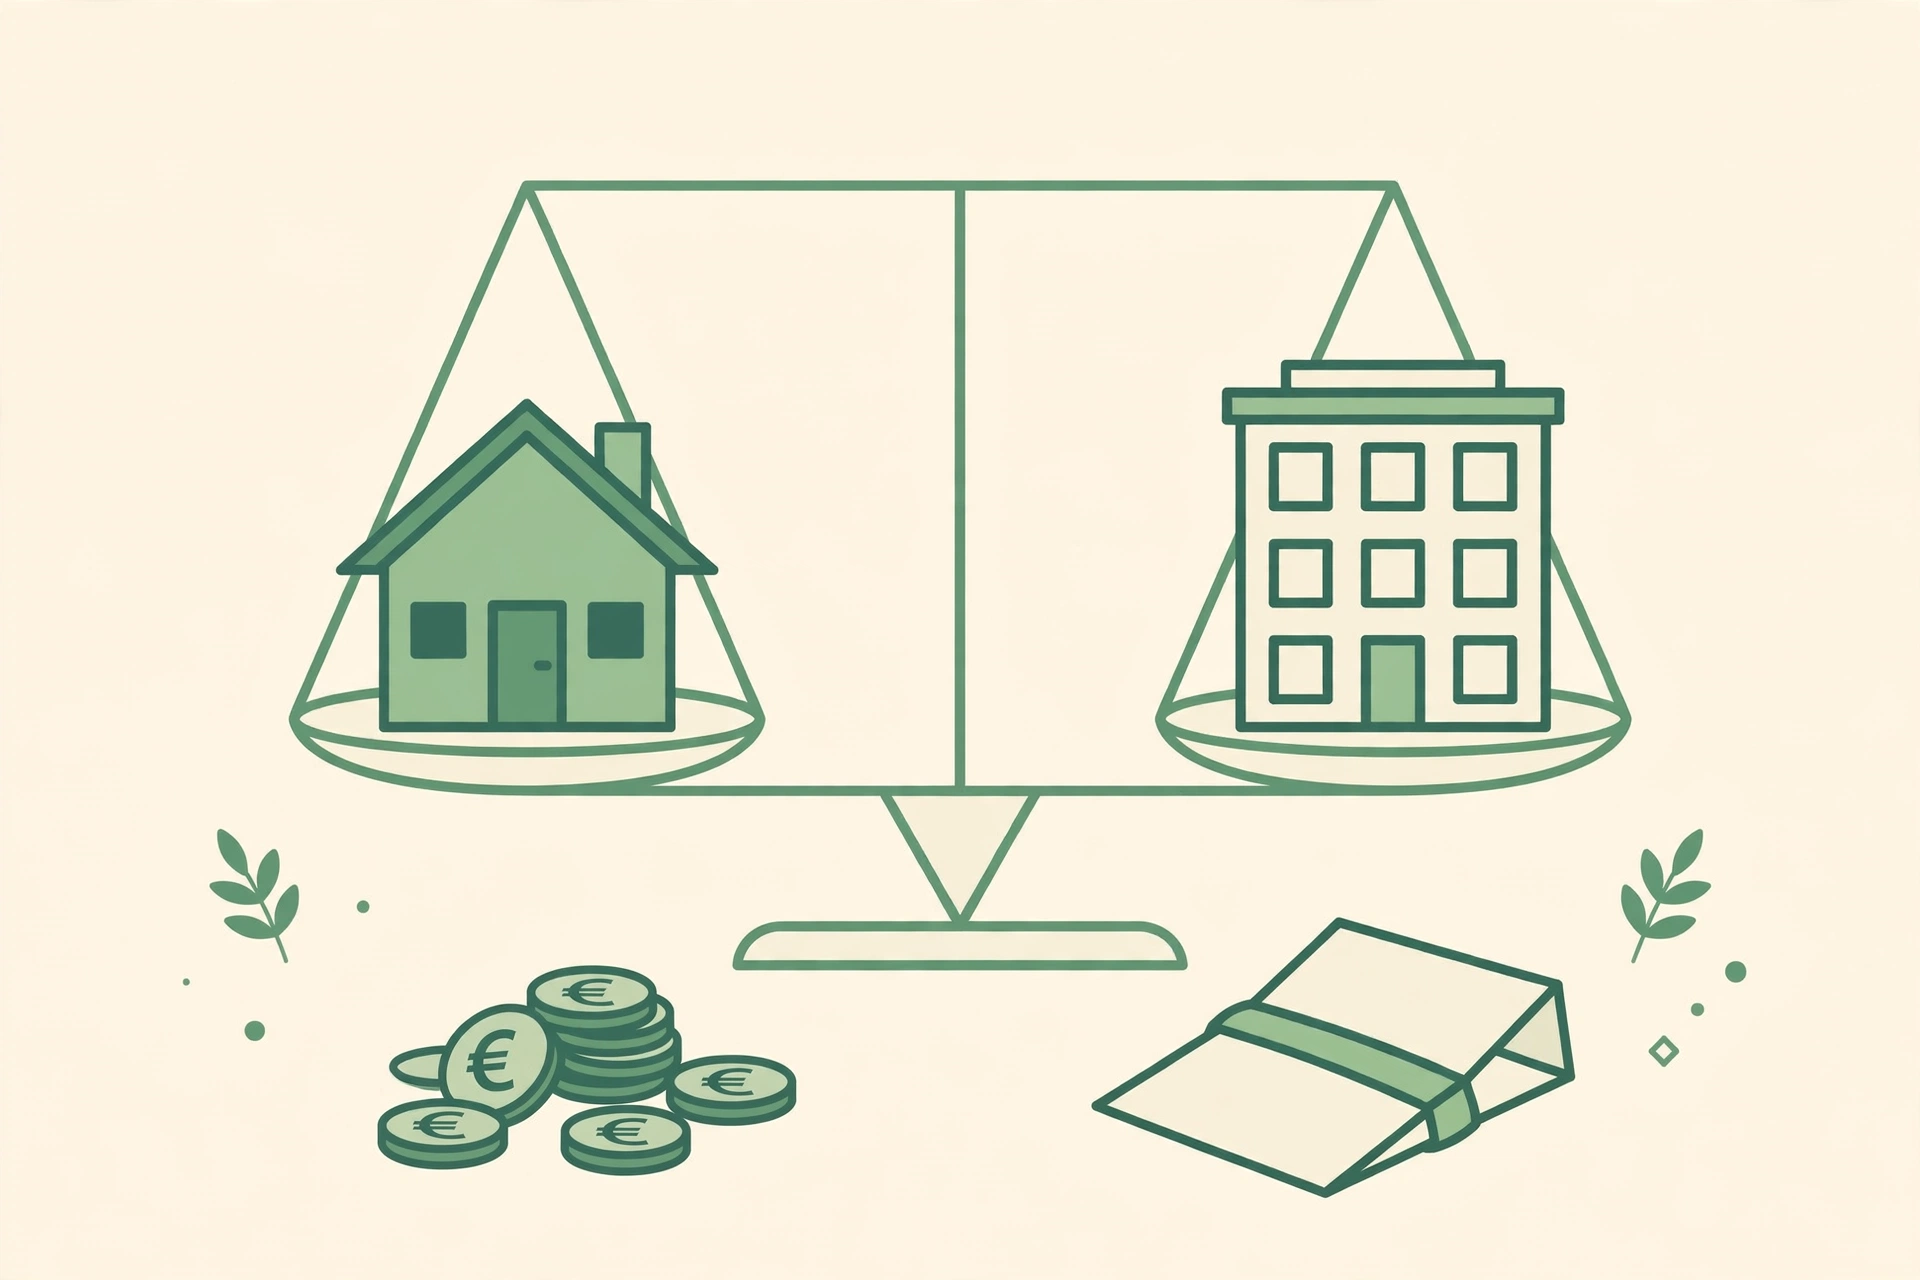
    Few money debates generate more heat and less light than rent vs buy. Renters are told they are throwing money away; buyers are warned they are chaining themselves to a mortgage. The truth is less dramatic and more useful: renting and buying are simply two different ways to pay for housing, and the cheaper option depends on your numbers, your timeline, and your life.

    This 2026 guide to rent vs buy walks through the true cost of each side, the break-even math that decides the winner, and the market and lifestyle factors the calculators miss. By the end, you will be able to run an honest comparison for your own situation — and stop taking advice from slogans.

    The Rent vs Buy Debate

    The debate feels tribal because both sides have a point. Buyers build equity with every payment and lock in their largest housing cost for decades. Renters keep their flexibility, avoid maintenance bills, and can invest the money they would have spent on a down payment. Both paths can build wealth; both can waste money.

    Where the debate goes wrong is in the absolutes. Rent is not “throwing money away” — it buys shelter, mobility, and freedom from repair costs, just as a mortgage payment buys equity, stability, and freedom from rent increases. The honest question behind rent vs buy is never which is morally superior, but which leaves you richer and happier given your timeline.

    That is why the rest of this guide ignores the slogans and does the arithmetic instead. When you compare rent vs buy with real numbers, the answer usually becomes obvious — and it is different for a 25-year-old who moves every two years than for a family settling in for a decade.

    True Cost of Renting

    Renting looks simple: one monthly payment and you are done. But the true cost of renting includes more than the check you write your landlord. Most leases add renters insurance, and many renters pay extra for parking, storage, or pet fees. The biggest hidden cost, though, is the annual increase — rents in many markets rise 3–5% a year, which compounds brutally over a decade.

    On a $1,800 rent rising 4% a year, you will pay about $21,600 in year one but roughly $31,700 in year ten — and more than $259,000 across the decade, with nothing to show for it but a roof that was never yours. That is the number buyers point to, and it is real.

    Renters also face costs buyers forget: moving every few years, application fees, and the risk of a non-renewed lease forcing an expensive move at the worst time. Still, renting buys something valuable — predictability. When the furnace dies at 2 a.m., it is the landlord’s problem, not yours, and that peace of mind has a genuine dollar value in any rent vs buy comparison.

    True Cost of Buying

    Buying looks like an investment, but the first years are mostly costs. A $400,000 purchase with 20% down means $80,000 gone from your savings on day one, plus 2–5% in closing costs. In the early years of a 30-year mortgage, most of each payment goes to interest, not equity — on a 7% loan, the first year’s payments are roughly 85% interest.

    Then come the ownership costs renters never see: property taxes, homeowners insurance, maintenance averaging 1–2% of the home’s value per year, and HOA dues where they apply. On that $400,000 home, the all-in monthly cost can easily run $800–$1,200 above the mortgage payment itself.

    The payoff is equity and stability. Each payment builds ownership, the principal-and-interest portion never rises, and after 15–30 years the biggest housing cost disappears entirely. Buying is expensive at the start and cheap at the end; renting is cheap at the start and expensive at the end. That timing difference is the heart of the rent vs buy decision.

    Break-Even Analysis

    The break-even point is the moment when buying becomes cheaper than renting — and it is the single most useful number in the rent vs buy debate. It answers one question: how long must I stay for the upfront costs of buying to pay off? For most buyers in average markets, the answer lands between 5 and 10 years.

    Here is a simplified example. Renting at $1,800 a month, rising 3% a year, costs about $63,000 over three years and $161,000 over seven. Buying a $400,000 home with $80,000 down at 7% costs roughly $90,000 in mortgage payments over three years — but about $25,000 of that built equity, and selling costs would eat most of the rest. At three years, renting usually wins; at seven, buying usually pulls ahead as equity compounds and rent keeps climbing.

    Your break-even depends on price-to-rent ratios, interest rates, tax benefits, and how fast local rents rise. The fastest way to find yours is to run your own figures through the free rent vs buy calculator, which compares total costs year by year and shows exactly when buying overtakes renting for your situation.

    Market Factors

    National averages lie; your market decides. In cities where home prices are 25 times annual rent, buying rarely wins unless you stay a very long time. In markets where the ratio is under 15, buying often wins within a few years. Look up your local price-to-rent ratio before anything else — it is the fastest single indicator of which side the rent vs buy math favors.

    Interest rates move the break-even dramatically. At 4%, buying wins much sooner; at 8%, renting stays competitive far longer because so much of each payment is interest. Local tax policy matters too: high property taxes and insurance premiums can add hundreds a month to ownership costs, while renter-friendly regulations can keep rent growth tame.

    For trustworthy data on local costs and buyer protections, the Consumer Financial Protection Bureau publishes guides and tools that help you compare markets with real numbers rather than anecdotes.

    Lifestyle Factors

    Math is only half the decision. If your career might move you in two years, buying is usually a losing bet — transaction costs of 8–10% round-trip will swamp any equity you build. Renting keeps you mobile, which has real career value when a better job is one city away.

    Stability cuts the other way. Families with school-age children often value the certainty of ownership: no landlord selling the property mid-school-year, no forced moves, and the freedom to renovate. If you know you will stay put for a decade, the lifestyle and financial cases for buying usually align.

    Be honest about your temperament too. Some people love maintaining a home; others resent every repair. There is no shame in renting for life if flexibility and simplicity are what make you happy — the rent vs buy choice should fit your life, not someone else’s definition of success.

    Common Mistakes

    The classic renter mistake is comparing rent to the mortgage payment alone. A $1,800 rent versus a $1,900 mortgage looks close — until taxes, insurance, maintenance, and HOA push the true ownership cost past $2,700. Always compare all-in costs on both sides.

    The classic buyer mistake is ignoring the timeline. Buying for a two-year stay is one of the costliest financial moves most people make: closing costs, agent commissions, and moving expenses can erase years of equity gains. Never buy without a realistic plan to stay past your break-even point.

    Both sides forget opportunity cost. A renter who invests the down payment can build serious wealth; a buyer who stretches too far can become house poor. Run the full comparison — including what your money could do elsewhere — and if buying wins, confirm the price fits your budget with the home affordability calculator before you shop.

    FAQ

    Is renting really throwing money away?

    No. Rent buys housing, flexibility, and freedom from maintenance — real value, not waste. The “throwing money away” framing ignores that homeowners also “throw away” interest, taxes, insurance, and maintenance. In any honest rent vs buy comparison, what matters is total cost and what you do with the difference, not slogans.

    What is the 5% rule for rent vs buy?

    A popular shortcut compares annual rent to 5% of a home’s price (covering roughly 3% for taxes and maintenance plus 2% cost of capital). If rent is well below 5% of the price, renting is likely cheaper; if it is above, buying deserves a closer look. It is a useful sniff test, not a substitute for full break-even math.

    How long do I need to stay for buying to beat renting?

    Typically 5–10 years in average markets, though it varies widely. High transaction costs punish short stays, while long stays let equity compound and leave rent inflation behind. If your horizon is under five years, renting usually wins the rent vs buy math; beyond ten, buying usually does.

    Does buying always build more wealth than renting?

    Not always. A disciplined renter who invests the down payment and the monthly savings in index funds can match or beat a homeowner’s equity — especially in expensive markets or at high interest rates. Buying builds wealth through forced savings and leverage; renting builds it through flexibility and lower costs. The winner is whoever invests the difference.

    What costs do first-time buyers forget?

    Closing costs (2–5% of the price), moving expenses, immediate repairs, furniture, and the ongoing 1–2% annual maintenance budget. New buyers also underestimate property tax reassessments and insurance increases. Budget a cash cushion beyond the down payment or the first year will be painful.

    Is it better to rent vs buy in 2026?

    It depends on your market and timeline more than the calendar year. Higher interest rates have pushed break-even points later in many cities, favoring renting for short horizons. But buyers planning decade-long stays still benefit from locking in payments while rents rise. Run current local numbers rather than deciding by headlines.

    Can I afford to buy, or should I keep renting?

    Buying only works if the price fits your income with room to spare — stretched buyers become house poor regardless of the break-even math. Check that the all-in monthly cost stays near 28% of gross income and that you will keep an emergency fund after closing. If either fails, renting while you save is the smarter move.

    What is the biggest rent vs buy mistake?

    Deciding by monthly payment alone. Renters forget rent increases; buyers forget taxes, maintenance, and transaction costs. The full comparison — all-in monthly costs, timeline, opportunity cost, and lifestyle fit — is the only one that counts.

    Key Takeaways

    • Renting is not wasted money and buying is not automatically smarter — total cost over your timeline decides.
    • Compare all-in costs: rent plus annual increases versus mortgage plus taxes, insurance, maintenance, and HOA.
    • The break-even point (usually 5–10 years) is the key number; never buy for a shorter stay.
    • Market factors — price-to-rent ratios, interest rates, and taxes — shift the answer by city.
    • Lifestyle matters: mobility favors renting, while long-term stability favors buying.
    • Run your own numbers before deciding; rules of thumb are starting points, not verdicts.

    Final Thoughts

    The rent vs buy debate will never have one universal winner, because the inputs are personal: your market, your timeline, your income, and how much you value flexibility versus roots. What the math consistently rewards is honesty — about the full costs, the real timeline, and what you will do with the money either way.

    Start with your break-even, stress-test it against higher rates and rent growth, and choose the option that leaves you wealthier and calmer in ten years. For deeper reading on the rent vs buy mechanics behind the numbers, Investopedia’s real estate guides are a solid next stop — then run your own comparison and decide with confidence.

  • How Compound Interest Works (With Examples)

    How Compound Interest Works (With Examples)

    How Compound Interest Works (With Examples)

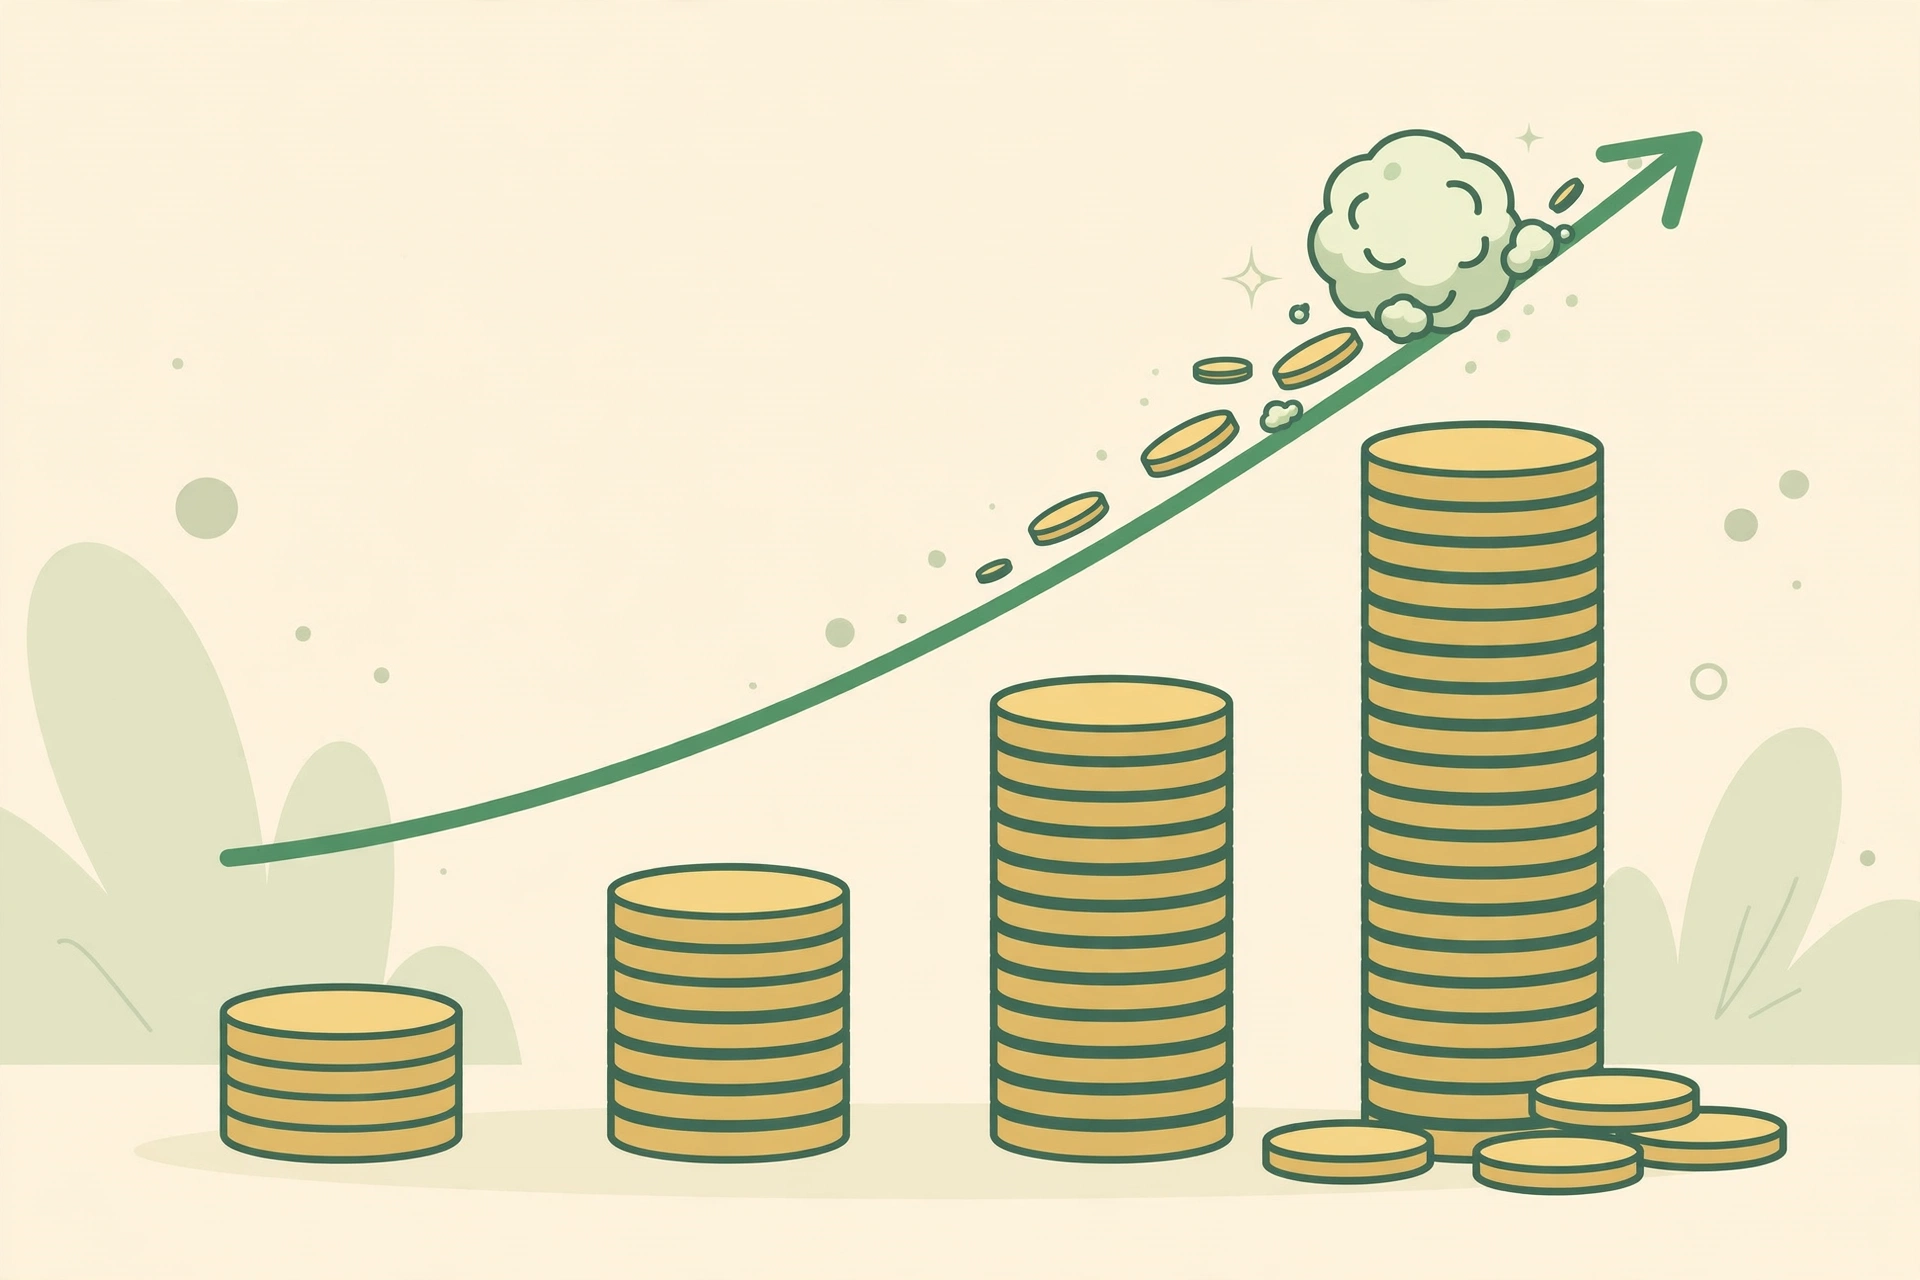
    Compound interest is the process by which your money grows when the interest you earn is added back to your original balance, so that future interest is calculated on an ever-larger amount. Earn a return, leave that return invested, and next year you earn a return on the return as well. Growth stops being a straight line and becomes a curve that bends upward — slowly at first, then startlingly fast. Understanding that curve, with real numbers rather than slogans, changes how people save more reliably than any amount of willpower advice.

    This guide explains how compound interest works from first principles: what it is, the formula behind it, worked examples you can check yourself, why starting early matters more than picking the perfect investment, and the mistakes that quietly destroy its power. You can test every figure in this guide with our free Compound Interest Calculator — change any number and watch the curve bend.

    What Is Compound Interest

    Compound interest is interest calculated on the initial amount of money you invest plus all the interest that has already accumulated. In other words, you earn interest on your interest. This is different from simple interest, which is calculated only on the original amount, or principal, and therefore grows at a constant, linear pace. With compounding, each interest payment increases the base on which the next payment is calculated, so the balance accelerates over time.

    A concrete comparison makes the difference clear. Suppose you invest $10,000 at 7% per year. With simple interest, you earn $700 every single year — $700 in year one, $700 in year twenty, $700 in year forty — for a total of $28,000 in interest after forty years. With compound interest at the same 7%, that same $10,000 grows to roughly $149,745 over forty years, meaning more than $139,000 of the final value is interest, and most of that interest was earned on earlier interest rather than on your original deposit.

    This is why compound interest is often called the engine of long-term wealth. The mechanism is identical whether your money sits in a savings account, a retirement fund, or a brokerage account: returns stay invested and generate their own returns. The only variables that matter are the rate of return, how often interest compounds, how much you add along the way, and — most importantly of all — how much time you give the process to work.

    How Compound Interest Works

    Compound interest works through a repeating cycle: interest is calculated on your current balance, that interest is added to the balance, and the next calculation uses the new, larger balance. Each cycle therefore starts from a higher base than the last one. In the early years the additions look modest, because the balance is small and the interest on the interest is tiny. As the years pass, however, the interest earned each year becomes large relative to your original deposit, and eventually it can exceed your annual contributions entirely.

    Consider the first few years of $10,000 growing at 7% with annual compounding. After year one, the balance is $10,700 — a $700 gain. In year two, the 7% is applied to $10,700, producing $749 of interest, and the balance becomes $11,449. In year three, interest is $801, and the balance is $12,250. Notice the pattern: the interest earned each year keeps rising even though the rate never changes. That rising annual gain is the signature of compounding, and it is the reason the growth curve bends upward instead of climbing in a straight line.

    The same process operates in reverse on debts, which is worth understanding now rather than later. When you carry a credit card balance, interest is calculated on the outstanding balance — including interest you have not yet paid — so an unpaid balance snowballs upward just as aggressively as savings snowball upward. Compound interest is a multiplier, and it multiplies whichever side of it you stand on. That symmetry explains why financial planners so often say that paying off high-interest debt is effectively the same as earning a guaranteed return equal to the debt’s interest rate.

    The Compound Formula

    The mathematics of compound interest is captured in a single, elegant formula: A = P(1 + r/n)^(nt). Here, A is the final amount, P is the principal or starting amount, r is the annual interest rate written as a decimal, n is the number of times interest compounds per year, and t is the number of years. Once you understand each piece, the formula becomes a practical planning tool rather than an intimidating equation.

    Let us work through it with real numbers. Take a principal of $10,000, an annual rate of 7% (so r = 0.07), monthly compounding (n = 12), and a time horizon of 10 years (t = 10). Plugging in: A = 10,000 × (1 + 0.07/12)^(12×10). The monthly rate is approximately 0.005833, and raising 1.005833 to the power of 120 gives about 2.0097. Multiply by $10,000 and the final amount is roughly $20,097 — slightly more than the $19,672 you would get with annual compounding, because interest starts earning its own interest a little earlier each month.

    The formula also reveals why time is the most powerful input. The exponent nt means that years multiply the effect of compounding rather than adding to it. Doubling the time horizon does far more than doubling the interest rate over long periods, because the exponent compounds on itself. This is the mathematical reason that starting ten years earlier can matter more than earning an extra percentage point of return — a fact the examples below will demonstrate clearly.

    Starting Early Advantage

    No illustration of compound interest is more persuasive than the classic comparison of an early starter and a late starter. Amara begins investing at age 25, putting $200 a month into an account earning 7% a year. At 35 she stops contributing entirely — ten years of contributions, $24,000 paid in — and simply leaves the balance invested until she is 65. Ben starts at 35 and invests the same $200 a month, every month, for thirty straight years, paying in $72,000 — three times as much money as Amara.

    At 65, Amara’s account is worth more than Ben’s, even though she contributed only a third as much. Her early decade bought her something that money contributed later cannot buy: extra years for every dollar to compound through additional doublings. Ben’s contributions, arriving in his forties and fifties, simply do not have enough time left to multiply to the same degree. The advantage of starting early is therefore not about being clever or lucky — it is about giving the exponent in the compound formula more room to work.

    The lesson is not that starting late is hopeless. Ben still ends up with a substantial sum, far better than the alternative of never starting at all. The lesson is that the most valuable contribution you will ever make is the next one, because it gets the longest compounding runway of any money you will ever invest. If you are reading this at 40 or 50, your version of starting early is today, and it beats your version of starting early next year by exactly the same logic that made Amara’s head start so decisive.

    Worked Examples

    Let us ground the theory in several worked examples you can verify. First, a lump sum with no additions: $10,000 invested at 7% with annual compounding grows to about $19,672 after 10 years, $38,697 after 20 years, $76,123 after 30 years, and $149,745 after 40 years. Study the shape of those numbers. The first doubling took a full decade; the balance added more in its fourth decade (roughly $73,600) than in its first three decades combined. This back-loaded pattern is the defining characteristic of compound growth.

    Second, the same scenario with regular contributions, which is how most people actually invest. Saving $200 a month at 7% for 20 years turns $48,000 of contributions into roughly $104,000 — meaning growth contributes more than half of the final value. Extend the horizon to 30 years and $72,000 of contributions becomes roughly $245,000, with growth contributing the large majority. Push it to 40 years and $96,000 of contributions becomes roughly $525,000. Each additional decade adds far more than the one before it, because every earlier dollar has had longer to compound.

    Third, a smaller, more accessible starting point, because many readers begin with modest sums. Investing $100 a month at 7% for 30 years produces roughly $122,700 from $36,000 of contributions. At a more conservative 5% return, the same habit produces roughly $81,900 — still more than double what was paid in. The precise return matters, but the habit of contributing steadily for decades matters more. Run your own numbers in the Compound Interest Calculator to see exactly how your amounts, rate, and timeline combine.

    Compound Interest Calculator

    See how savings and investments grow with compound interest and monthly contributions.

    Your result

    Formula

    Future value = lump sum grown at (1+r)^years, plus each monthly contribution compounded for the months remaining.

    How to use this calculator

    Enter what you start with, what you add each month, the expected annual return and the time horizon.

    Worked example

    Example: €10,000 plus €200/month at 7% for 20 years grows to about €142,882 — most of it from compounding, not contributions.

    Frequently asked questions

    Is the return guaranteed?No. The rate you enter is an assumption; real investment returns vary year to year.
    How often is interest compounded?Monthly in this calculator, which matches most savings and investment projections.

    Compounding Frequency

    Compounding frequency — how often interest is calculated and added to your balance — changes your results, though less dramatically than the rate or the time horizon. Banks and investments may compound annually, semiannually, quarterly, monthly, or daily. More frequent compounding means interest starts earning its own interest sooner, so the effective growth is slightly higher at any given headline rate.

    The numbers: $10,000 at 7% for 10 years grows to about $19,672 with annual compounding, $19,905 with semiannual compounding, $20,015 with quarterly compounding, $20,097 with monthly compounding, and $20,137 with daily compounding. The gap between annual and daily compounding over a decade is roughly $465 on a $10,000 investment — noticeable, but small compared with the effect of adding a single extra year (worth roughly $1,376) or raising the rate by one percentage point.

    Two practical conclusions follow. First, when comparing savings accounts or bonds, do not choose based on compounding frequency alone; the annual percentage yield, which already accounts for frequency, is the number to compare. Second, for long-term planning, frequency is a detail rather than a driver — focus your energy on the contribution amount, the return, and the time horizon. That said, daily compounding does have one unbeatable advantage in the real world: it is how most credit card debt compounds, which is one reason unpaid balances grow so relentlessly.

    Common Mistakes

    The most expensive mistake with compound interest is simply starting late. Every year of delay is a year of compounding permanently lost, and as the Amara and Ben example showed, lost years cannot be recovered by contributing more later. People delay because the early gains look unimpressive — $700 on $10,000 in year one hardly feels life-changing — and they underestimate how dramatically the curve steepens in later decades. The cure is to start with whatever amount is sustainable today rather than waiting until you can invest a larger sum.

    A second common mistake is interrupting compounding by withdrawing gains or pausing contributions during market downturns. Selling investments in a panic locks in losses and, just as importantly, removes capital from the compounding cycle at exactly the moment when depressed prices offer the strongest future growth. A third mistake is ignoring fees, which compound against you with the same relentlessness: a 1% annual fee on an account earning 7% does not merely cost 1% — over 30 years it can consume roughly a quarter of your potential final balance, because the fee also compounds.

    Finally, many savers let compound interest work against them through high-interest debt while simultaneously trying to invest. Carrying a credit card balance at 24% APR while earning 7% in the market is not diversification — it is a guaranteed loss, because the debt compounds faster than the investments. The mathematically correct order of operations for most households is to capture any employer retirement match first (an instant doubling no market can match), eliminate high-interest debt second (a guaranteed return equal to its rate), and invest for the long term third.

    Frequently Asked Questions

    What is compound interest in simple terms?

    Compound interest means earning interest on both your original money and on the interest you have already earned. Each time interest is added to your balance, the next interest payment is calculated on the bigger balance, so your money grows faster and faster over time instead of growing at a constant pace.

    What is the formula for compound interest?

    The standard formula is A = P(1 + r/n)^(nt), where A is the final amount, P is the starting principal, r is the annual rate as a decimal, n is how many times per year interest compounds, and t is the number of years. For example, $10,000 at 7% compounded monthly for 10 years becomes roughly $20,097.

    How does compound interest differ from simple interest?

    Simple interest is calculated only on the original principal, so it grows linearly — $700 a year on $10,000 at 7%, every year, forever. Compound interest is calculated on the principal plus accumulated interest, so the annual gain rises each year. Over long periods the difference is enormous: $10,000 at 7% for 40 years becomes $38,000 with simple interest but roughly $149,745 with compounding.

    How long does it take money to double with compound interest?

    Use the Rule of 72: divide 72 by your annual return to estimate the doubling time in years. At 7%, money doubles in about 10.3 years; at 10%, in about 7.2 years; at 5%, in about 14.4 years. The rule also works in reverse for inflation: at 3% inflation, uninvested cash loses half its buying power in about 24 years.

    How often should interest compound?

    The more frequently interest compounds, the slightly faster your money grows at the same headline rate. However, the difference between monthly and annual compounding is modest compared with the effects of the rate, your contributions, and the time horizon. When comparing accounts, look at the annual percentage yield, which already includes the frequency effect.

    Does compound interest work with monthly contributions?

    Yes — and regular contributions supercharge compounding. Each contribution starts its own compounding journey, and earlier contributions have more time to multiply. Saving $200 a month at 7% for 30 years turns $72,000 of contributions into roughly $245,000, with growth contributing the majority of the final value.

    Can compound interest work against you?

    Absolutely. The same mathematics that builds savings also builds debt: unpaid credit card balances compound monthly at rates that can exceed 20% APR, so the balance snowballs upward. This is why clearing high-interest debt is usually the highest-return move available — it is equivalent to earning a guaranteed return equal to the debt’s interest rate.

    What is a realistic return to assume for long-term planning?

    Many planners use 6–7% annual returns for a diversified stock portfolio after inflation, while savings accounts historically deliver far less. Be conservative in your assumptions: it is better to be pleasantly surprised than to discover at 60 that your plan required returns the market never delivered. Test a range of rates in a calculator rather than relying on a single optimistic number. For an independent reference, the U.S. Securities and Exchange Commission’s compound interest calculator and the mathematics of compound interest are authoritative starting points.

    Key Takeaways

    Compound interest grows your money by paying interest on previously earned interest, creating an upward-bending curve that accelerates over time. Time is the most powerful input in the formula — starting a decade earlier typically beats earning a higher return later. Regular contributions multiply the effect, because each deposit begins its own compounding journey. Compounding frequency matters only modestly, while fees and high-interest debt compound against you with equal force. Finally, the mechanism works identically for everyone: it rewards starting, continuing, and leaving the money alone.

    Final Thoughts

    The wonder of compound interest is not really the mathematics — the formula fits on one line. The wonder is that it works for anyone patient enough to use it, regardless of income. You do not need to predict markets, time your entries, or find exotic investments. You need a sustainable monthly amount, a sensible long-term return, and the discipline to let decades do what decades do. Open the Compound Interest Calculator, enter your own numbers, and look at what your future self could have — then start this month, because the best compounding day was ten years ago and the second-best is today.

  • What Is a Healthy BMI? Ranges, Limits and What to Do Next

    What Is a Healthy BMI? Ranges, Limits and What to Do Next

    What Is a Healthy BMI? Ranges, Limits and What to Do Next

    Body Mass Index, or BMI, is the most widely used weight screening tool on the planet — calculated in seconds from just your height and your weight, yet powerful enough to guide conversations with your doctor. If you want to learn how to calculate BMI yourself, you are in the right place: the formula takes less than a minute to apply, and understanding what the result means — and what it does not mean — turns a bare number into genuinely useful health information. This guide walks through how to calculate BMI step by step, the healthy ranges, the limitations everyone should know, and what to do with your result. You can check your own numbers instantly with our free BMI Calculator.

    What Is BMI

    BMI is a numerical value derived from a person’s weight and height that places them into broad weight categories: underweight, healthy weight, overweight, or obese. It was developed in the 1830s by the Belgian mathematician Adolphe Quetelet as a statistical tool for populations, and it became a clinical standard because it correlates reasonably well with body fat levels across large groups of people. Doctors, insurers, and researchers use it as a first screening step — not a diagnosis, but a signal that says whether a closer look is warranted.

    What BMI is not matters just as much. It cannot measure body fat directly, distinguish muscle from fat, or tell you where fat is stored on your body — and fat distribution matters enormously for health risk. Two people with identical BMIs can have very different health profiles: a weightlifter and a sedentary office worker may share the same number while carrying completely different amounts of body fat. Keeping this limitation in mind from the start is what separates people who use BMI wisely from people who let a single number dictate how they feel about their health.

    How to Calculate BMI

    Learning how to calculate BMI is straightforward, because the formula needs only two measurements: your weight and your height. First, weigh yourself on a reliable scale, ideally in the morning before eating and wearing light clothing. Second, measure your height accurately against a wall without shoes. Third, plug both numbers into the BMI formula below. That is the entire process — no blood tests, no special equipment, no appointments.

    Once you have your number, compare it against the standard adult categories: below 18.5 is underweight, 18.5 to 24.9 is the healthy range, 25 to 29.9 is overweight, and 30 or above is obese. These cutoffs come from large population studies linking BMI ranges to health outcomes, and they are the same thresholds used by the World Health Organization. If mental arithmetic is not your idea of fun, the BMI Calculator does the whole calculation for you and shows exactly which category you fall into.

    The BMI Formula

    The metric BMI formula is: BMI = weight in kilograms ÷ (height in metres)². In words: take your weight in kilograms and divide it by your height in metres squared. For example, a person who weighs 70 kg and stands 1.75 m tall calculates 70 ÷ (1.75 × 1.75) = 70 ÷ 3.0625 = 22.9, which sits comfortably inside the healthy range.

    If you work in pounds and inches, the imperial version is: BMI = 703 × weight in pounds ÷ (height in inches)². The 703 is simply a conversion factor that makes the imperial units equivalent to the metric formula. An example: a person weighing 154 lb at 5 feet 9 inches (69 inches) tall calculates 703 × 154 ÷ (69 × 69) = 108,262 ÷ 4,761 = 22.7 — again, a healthy result. Both formulas give the same answer for the same body; use whichever matches the units on your scale and tape measure.

    Precision matters less than consistency. Bathroom scales typically vary by half a kilogram, and height changes slightly through the day as spinal discs compress, so your BMI will naturally wobble by a few tenths. That is normal and not worth chasing. Weigh and measure under the same conditions each time — same time of day, same clothing — and watch the trend over weeks and months rather than reacting to any single reading.

    Healthy BMI Ranges

    The standard adult BMI categories are: under 18.5 (underweight), 18.5–24.9 (healthy weight), 25–29.9 (overweight), and 30 or above (obese, sometimes subdivided into class I, II, and III at 30, 35, and 40). These ranges were set by observing where disease risk starts to climb in large populations. People in the healthy range have, on average, the lowest risk of weight-related conditions such as type 2 diabetes, heart disease, and certain cancers — which is why clinicians treat 18.5–24.9 as the target zone for most adults.

    Context turns the ranges into something actionable. A BMI of 26 does not diagnose anything, but it is a prompt to check the other pieces of the picture: waist circumference, blood pressure, blood sugar, cholesterol, activity level, and family history. Conversely, a BMI of 23 with a large waist measurement and high blood pressure deserves more attention than the number alone suggests. The healthiest approach is to treat your BMI as one dial on a dashboard rather than the whole dashboard — the BMI Calculator gives you the number, and the sections below help you interpret it like a clinician would.

    BMI Limitations

    BMI’s greatest weakness is that it cannot tell muscle apart from fat. Because muscle is denser than fat, very muscular people can record BMIs in the overweight or even obese range while carrying little body fat and excellent cardiovascular fitness. This is the most common reason a BMI reading misleads, and it is why the next section on athletes exists. If you lift weights regularly or play a strength-based sport, treat your BMI with extra skepticism.

    Body shape and life stage create further blind spots. Fat stored around the abdomen carries more health risk than fat stored on the hips and thighs, yet BMI treats both identically — which is why waist measurement is the standard companion check. Age matters too: older adults naturally lose muscle, so a BMI that was healthy at 30 can mask rising body fat at 70. Pregnancy, of course, makes BMI meaningless as a weight gauge, and for children and teenagers BMI must be interpreted against age- and sex-specific growth charts rather than adult cutoffs. None of this makes BMI useless; it makes BMI a screening tool that works best when its known limits are respected.

    BMI for Athletes

    Athletes are the classic case where BMI needs a knowledgeable interpreter. A rugby forward or a competitive weightlifter with substantial muscle mass can easily post a BMI of 28 or 30 — technically overweight or obese — while having low body fat, strong cardiovascular fitness, and excellent metabolic markers. Coaches and sports physicians have known this for decades, which is why athletic programs rarely use BMI alone to judge body composition.

    If you are athletic and your BMI reads high, the practical checks are simple. Measure your waist at the navel: for most adults, keeping it under roughly half your height is a good sign regardless of BMI. Consider a body-fat estimate — skinfold calipers, bioelectrical impedance scales, or a DEXA scan — which measures what BMI can only guess at. And look at performance and health markers: resting heart rate, blood pressure, blood lipids, and how you actually feel and move. When those are all healthy, a high BMI in a muscular athlete is a measurement artifact, not a health warning. The formula did its job; it just measured the wrong thing for your body type.

    Common Mistakes

    The most frequent mistake when people learn how to calculate BMI is mixing up the units — entering height in centimetres into the metres formula, or forgetting to square the height. A height of 175 cm entered as 175 instead of 1.75 produces a nonsense result, so double-check that your height is in metres (or use the 703 imperial version with inches). The second mistake is using stale measurements: weighing yourself once a year in winter clothing and wondering why the number looks odd. Fresh, consistent measurements are the whole game.

    A subtler mistake is treating the category boundaries as cliffs. The difference between a BMI of 24.9 and 25.1 is physiologically negligible, yet one is labelled healthy and the other overweight — the labels are administrative conveniences, not biological switches. Health risk rises gradually across the scale, so someone at 25.2 with an active lifestyle and good bloodwork is typically in better shape than someone at 24.8 who smokes and never exercises. Finally, the biggest mistake of all is letting the number become an identity: BMI is a screening number, and reacting to it with crash diets or despair does more harm than the number ever could. Steady habits move it; panic does not.

    Frequently Asked Questions

    How do I calculate my BMI manually?

    Divide your weight in kilograms by your height in metres squared: BMI = kg ÷ m². For example, 70 kg ÷ (1.75 × 1.75) = 22.9. In imperial units, use BMI = 703 × pounds ÷ inches². Our BMI Calculator does the arithmetic for you in either system.

    What is a good BMI for my age?

    For adults of any age, the standard healthy range is 18.5–24.9, although some evidence suggests slightly higher BMIs may be acceptable for adults over 65 because of natural muscle loss. For children and teenagers, BMI is interpreted against age- and sex-specific percentile charts rather than the adult cutoffs, so a paediatrician’s growth chart is the right reference.

    Is BMI accurate for muscular people?

    Often not. Muscle is denser than fat, so muscular people can have overweight-range BMIs with low body fat. If you train with weights and your BMI reads high, check your waist-to-height ratio and consider a body-fat measurement for a clearer picture of your composition.

    What BMI is considered obese?

    A BMI of 30 or above is classified as obese for adults, with subdivisions at 35 (class II) and 40 (class III). These thresholds mark the points where population studies show markedly higher risks of conditions like type 2 diabetes and heart disease — but individual risk still depends on factors like waist size, blood pressure, and fitness.

    Does BMI differ for men and women?

    The formula and the adult cutoffs are the same for men and women. On average, women carry a higher percentage of body fat than men at the same BMI, which is one reason clinicians pair BMI with waist measurement and other indicators rather than relying on it alone.

    How is BMI calculated for children?

    The calculation is identical — weight divided by height squared — but the interpretation differs. A child’s BMI is plotted on an age- and sex-specific growth chart to produce a percentile: below the 5th percentile is underweight, 5th–85th is healthy, 85th–95th is overweight, and at or above the 95th is obese. Paediatricians use these charts at check-ups.

    What should I do if my BMI is high?

    Treat it as a prompt, not a verdict. Confirm the measurement, check your waist circumference, and review the broader picture — activity, diet, sleep, blood pressure, and blood sugar. Sustainable habits move BMI reliably: regular movement, protein- and fibre-rich meals, consistent sleep, and modest calorie awareness. If your BMI is 30 or above, or you have related health concerns, a conversation with your doctor is the sensible next step.

    Can my BMI be too low?

    Yes. A BMI below 18.5 is classified as underweight and can signal inadequate nutrition, muscle loss, or an underlying health issue — particularly if the weight loss was unintentional. Low BMI is associated with weakened immunity, bone loss, and fertility problems, so it deserves the same seriousness as a high reading. Speak with a healthcare professional if your BMI sits below the healthy range. For background reading, the CDC’s guide to BMI and the WHO fact sheet on overweight and obesity are authoritative references.

    Key Takeaways

    Learning how to calculate BMI takes a minute: weight in kilograms divided by height in metres squared, or the 703 imperial equivalent. The healthy adult range is 18.5–24.9, but the number is a screening tool, not a diagnosis — it cannot distinguish muscle from fat or account for where fat is stored. Athletes, older adults, pregnant women, and children all need adjusted interpretation. Pair your BMI with a waist measurement and the broader health picture, and treat category boundaries as gradual risk slopes rather than cliffs.

    Final Thoughts

    BMI endures because it is free, instant, and right often enough to be useful — a rare combination in health measurement. Calculate yours, note which category it falls in, and then do the wiser thing: look past the number to the habits and markers that actually determine your health. Open the BMI Calculator, run your figures, and use the result as the starting point of a conversation — with your doctor, your training plan, or simply your own routine — rather than the final word on your body.

  • Paycheck to Hourly: How to Convert Your Salary

    Paycheck to Hourly: How to Convert Your Salary

    Paycheck to Hourly: How to Convert Your Salary

    Two job offers land on the table: one pays $78,000 a year, the other pays $38 an hour. Which is better? Without a paycheck to hourly conversion, you are comparing two numbers in different languages — and most people guess wrong. Converting a salary into its true hourly rate is the skill that makes job offers, raises, overtime, and side gigs directly comparable. This guide shows you how to do it correctly: the formula, worked examples, the adjustments for overtime and benefits that most guides skip, and the mistakes that quietly distort the answer. Run your own figures alongside with our free Salary to Hourly Calculator.

    Why Convert Paycheck to Hourly

    A yearly salary is a bundled number: it hides how many hours you actually work, how much overtime goes unpaid, and how valuable your benefits are per hour. Two people earning the same $70,000 can have very different real wages — one works a strict 40-hour week, the other routinely works 55. Converting paycheck to hourly exposes that difference in a single number you can compare against any other offer, any freelance rate, or any raise proposal.

    The conversion also changes everyday decisions. It tells you what an hour of your time is worth, which makes trade-offs concrete: is the two-hour commute worth it, should you take the overtime shift, does the side project pay more than your day job per hour? Salary feels abstract; an hourly rate is a price tag on your time. Once you know yours, you start spending your hours the way you spend your money — deliberately.

    The Conversion Formula

    The paycheck to hourly formula is simple: hourly rate = annual gross salary ÷ total hours worked per year. The standard full-time assumption in the United States is 40 hours per week × 52 weeks = 2,080 hours per year. So a $60,000 salary converts to $60,000 ÷ 2,080 = $28.85 per hour. That is the headline version — but the honest version adjusts the hours to your reality, which the next sections cover.

    For the reverse conversion, hourly to salary: annual salary = hourly rate × hours worked per week × 52. A $38 hourly wage at 40 hours a week becomes $38 × 40 × 52 = $79,040 a year. Keep the units consistent and the arithmetic does the rest. And remember the golden rule of this conversion: garbage hours in, garbage rate out. A precise salary divided by a fantasy work schedule produces a precise-looking fiction. The formula is only as honest as the hours you feed it.

    Worked Examples

    Let us run the conversion for the salaries people meet most often, using the standard 2,080-hour year. A $50,000 salary becomes $24.04 per hour. $60,000 becomes $28.85. $75,000 becomes $36.06. $90,000 becomes $43.27. $100,000 becomes $48.08. $120,000 becomes $57.69. Memorize the anchor points nearest your own pay and you will be able to sanity-check any offer in seconds — a skill that pays for itself the first time you use it in a negotiation.

    Now the same salaries with realistic hours instead of the textbook 2,080. Take the $78,000 offer from the introduction: at a true 40-hour week it is $37.50 an hour, but if the role routinely demands 50 hours, the denominator becomes 2,600 and the real rate is $30.00 an hour — suddenly the $38-an-hour offer wins outright. This is why the conversion matters: the $78,000 offer only looked better because its hours were hidden. Always ask about typical weekly hours before you convert, because the hours are where the truth lives.

    Salary to Hourly Calculator

    Convert an annual salary into hourly, daily, weekly, monthly and biweekly pay.

    Your result

    Formula

    Hourly rate = annual salary / (hours per week x weeks per year).

    How to use this calculator

    Enter your gross annual salary and your usual weekly hours and working weeks.

    Worked example

    Example: €75,000 at 40 hours/week for 52 weeks is €36.06/hour.

    Frequently asked questions

    Is this gross or take-home pay?Gross. Use the Paycheck Calculator to estimate take-home pay.
    What if I get unpaid time off?Reduce the weeks per year to match the weeks you are actually paid for.

    Overtime Adjustments

    If you work overtime, your paycheck to hourly conversion needs two rates, not one. In the U.S., non-exempt employees must generally be paid at least 1.5 times their regular rate for hours beyond 40 in a week under the Fair Labor Standards Act — time-and-a-half. So a $28.85 base rate becomes $43.28 for each overtime hour. Someone working 45 hours a week at that base earns (40 × $28.85) + (5 × $43.28) = $1,154 + $216.40 = $1,370.40 per week, which annualizes to about $71,260 — meaningfully more than the $60,000 the base rate alone implied.

    Salaried exempt workers face the mirror image: overtime hours dilute the hourly rate because the pay does not rise with the hours. A $60,000 salaried employee working 50-hour weeks earns an effective $23.08 per hour, not $28.85 — a 20% pay cut hiding in plain sight. Before accepting a salaried role with a heavy-hours reputation, convert with the real hours, not the contracted ones. The U.S. Department of Labor’s overtime pay guidance explains which roles qualify for mandatory overtime, and the Bureau of Labor Statistics wage statistics show what comparable roles actually pay per hour across the country.

    Benefits Value

    Salary is only part of compensation, and a paycheck to hourly conversion that ignores benefits understates what a job is really worth per hour. Health insurance, retirement matching, paid time off, and bonuses all have dollar values — add them to the salary before dividing. A $70,000 salary with $8,000 of health coverage, a $3,500 retirement match, and $2,500 in bonuses is really $84,000 of compensation, or $40.38 an hour at 2,080 hours instead of $33.65. That $6.73-an-hour gap is the difference between an offer that looks average and one that is genuinely strong.

    Paid time off deserves its own adjustment because it shrinks the hours denominator. Two weeks of paid vacation plus holidays means roughly 1,960 working hours instead of 2,080, which lifts every hourly figure by about 6%. Conversely, unpaid time off expands the effective denominator of your life while shrinking the paycheck — always convert with paid hours when comparing offers. When an employer says “we can’t move on salary,” the hourly math often reveals that a better benefits package, an extra week of vacation, or a signing bonus closes the gap more cheaply than they imply.

    Negotiation Uses

    The hourly rate is a negotiation weapon because it reframes the conversation around your time. When an offer of $65,000 requires 50-hour weeks, you can say plainly: “At the hours this role typically demands, that’s $25 an hour — I’d need $72,800 to match the $28 an hour I earn now.” That sentence is hard to argue with because it is arithmetic, not attitude. Employers negotiate in salaries; you should negotiate in the hourly truth behind them.

    The conversion also sets your freelance and consulting floor. If your day job pays an effective $40 an hour including benefits, freelance work must beat that by a margin covering self-employment tax, unpaid admin time, and the absence of benefits — typically 25–50% more, or $50–$60 an hour, just to break even. Knowing your number stops you from accepting side work that pays less per hour than the job you already have. And when a raise arrives, convert it: a 3% raise on $60,000 is $1,800 a year, or about 87 cents an hour — useful context for deciding whether the raise or the job search deserves your energy.

    Common Mistakes

    The most common mistake in any paycheck to hourly conversion is using gross pay but comparing it to take-home needs — or the reverse. The standard conversion uses gross salary, before taxes and deductions. If you want your spendable hourly rate, subtract taxes, retirement contributions, and insurance premiums first, then divide. Both numbers are useful; confusing them is not. A $28.85 gross rate might be $21–$22 after deductions, and budgeting on the gross figure is how people end up surprised every month.

    The second mistake is the fantasy 2,080: dividing by textbook full-time hours when you actually work 45, 50, or 60. Salaried workers are especially prone to this, because the extra hours are unpaid and therefore invisible on the pay stub. Track your real hours for two or three typical weeks — including email at night and weekend catch-up — and use that average. The third mistake is forgetting that the conversion runs both ways on lifestyle inflation: a raise to $75,000 that comes with 55-hour weeks can lower your real hourly rate even as your salary rises. Convert before you celebrate.

    Frequently Asked Questions

    How do I convert my salary to an hourly rate?

    Divide your annual gross salary by the number of hours you work per year. The standard is 2,080 hours (40 hours × 52 weeks): $60,000 ÷ 2,080 = $28.85 per hour. For accuracy, use your real weekly hours — including regular overtime — instead of the textbook figure. Our Salary to Hourly Calculator handles the arithmetic and the adjustments.

    What is the standard number of work hours per year?

    The U.S. standard for full-time work is 2,080 hours per year: 40 hours per week multiplied by 52 weeks. Subtract paid time off for a truer figure — two weeks of vacation brings it to about 2,000 hours — and use your actual typical week if you regularly work more or fewer than 40 hours.

    How do I convert an hourly wage to a yearly salary?

    Multiply the hourly rate by hours worked per week, then by 52: $30 × 40 × 52 = $62,400 per year. Adjust for unpaid time off by using the weeks you actually get paid, and remember this gives gross pay before taxes and deductions.

    Should I include overtime in the conversion?

    Yes — it changes the answer significantly. For hourly workers, overtime usually pays 1.5× the base rate, which raises total annual earnings above the simple conversion. For salaried exempt workers, unpaid overtime hours dilute the effective rate, so they belong in the denominator. Either way, realistic hours beat textbook hours.

    Does the conversion use gross or net pay?

    The standard paycheck to hourly conversion uses gross pay — your salary before taxes, insurance, and retirement deductions. For budgeting, compute a second version with net (take-home) pay to find your spendable hourly rate. Label which one you are using whenever you compare offers.

    How do benefits change my true hourly rate?

    Add the annual dollar value of benefits — health insurance, retirement matching, bonuses, paid time off — to your salary before dividing by hours. A $70,000 salary with $14,000 in benefits is $84,000 of compensation, worth about $6.70 more per hour than the salary alone suggests.

    Is it better to be paid hourly or salary?

    It depends on your hours and priorities. Hourly work compensates overtime and protects your time; salaried work offers predictable pay and often better benefits and flexibility. Convert both options to true hourly rates — including realistic hours and benefits — and the better deal usually becomes obvious.

    How do I convert a biweekly paycheck to hourly?

    Multiply the biweekly gross amount by 26 pay periods to get the annual salary, then divide by annual hours. A $2,500 biweekly paycheck is $65,000 a year, which is $31.25 an hour at 2,080 hours. Note that two months a year contain three paychecks — the 26-period math already accounts for that.

    Key Takeaways

    Converting paycheck to hourly means dividing annual gross pay by real hours worked — 2,080 is the standard, your actual schedule is the truth. Overtime raises the rate for hourly workers and dilutes it for salaried ones. Benefits and paid time off belong in the calculation, because total compensation per hour is what offers should be judged on. The resulting number is your price of time: use it to compare offers, price freelance work, evaluate raises, and negotiate from arithmetic instead of guesswork.

    Final Thoughts

    Salary is how employers talk; hourly is how your life is actually priced — in mornings, evenings, and weekends traded for money. The paycheck to hourly conversion takes thirty seconds and permanently changes how you read every offer, raise, and timesheet you will ever see. Run your own numbers in the Salary to Hourly Calculator, write the result somewhere you will see it, and let it do its quiet work the next time someone asks what your time is worth.

  • How to Pay Off Credit Card Debt Faster

    How to Pay Off Credit Card Debt Faster

    How to Pay Off Credit Card Debt Faster

    If you want to pay off credit card debt faster, the single biggest lever is not willpower — it is math. Credit card interest compounds against you every single day, so the gap between making minimum payments and making a fixed accelerated payment can be worth thousands of dollars and several years of your financial life. The good news: with a clear plan, a fixed monthly payment, and the right payoff order, most people can become debt-free far sooner than they think.

    This guide walks you through the complete process to pay off credit card debt: why balances grow so quickly, the two proven payoff methods compared side by side, a step-by-step plan you can build today, ways to cut your interest rate, and the habits that keep debt from coming back. Work through it in order, and by the end you will have a payoff date you can actually believe in.

    Why Credit Card Debt Grows

    Credit card debt grows fast for three structural reasons. First, the interest rates are high — the average credit card APR sits well above 20%, which is several times the rate of a mortgage or auto loan. Second, interest compounds daily: each day’s interest is calculated on the previous day’s balance plus the interest already added, so the balance snowballs even when you are not spending. Third, minimum payments are deliberately small, usually around 1–2% of the balance, which means most of your payment goes to interest and only a sliver touches the principal.

    Consider a concrete example. A $5,000 balance at 24% APR with a $125 minimum payment takes roughly 15 years to clear and costs more than $6,000 in interest alone — you pay back more than double what you borrowed. Raise that payment to a fixed $250 a month and the same debt disappears in about 2 years with roughly $1,300 in interest. Same balance, same card — the only difference is the payment strategy. That is why every plan in this guide starts with abandoning the minimum payment and committing to a fixed amount.

    Late fees and penalty APRs make the trap worse. One missed payment can trigger a fee of $30 or more and, on some cards, a penalty rate near 30% that applies to your existing balance. This is exactly why the first step of any payoff plan is to automate at least the minimum payment on every card — protecting yourself from fees and penalty rates costs nothing and keeps the math in your favor.

    Avalanche vs Snowball

    When you carry balances on several cards, the order in which you attack them matters almost as much as the size of your payment. The two classic strategies are the avalanche and the snowball, and understanding both helps you choose deliberately instead of guessing.

    The avalanche method targets the highest interest rate first. You pay minimums on every card and throw every extra dollar at the card with the highest APR. Mathematically, this is the cheapest and fastest approach: every dollar goes where it kills the most interest. If you owe $4,000 at 26%, $3,000 at 19%, and $1,500 at 15%, the avalanche clears the 26% card first, then the 19%, then the 15%.

    The snowball method targets the smallest balance first, regardless of rate. Using the same example, you would clear the $1,500 card first, then the $3,000, then the $4,000. You pay slightly more interest overall, but you get a full payoff — a closed account and a psychological win — much sooner. For many people, that early momentum is the difference between sticking with the plan and giving up in month four.

    Which should you choose? If the rate gap between your cards is large (say, 8 points or more), the avalanche saves meaningful money and is usually worth it. If your rates are similar or you know you need quick wins to stay motivated, the snowball is the better behavioral choice. Run both orders through our Credit Card Payoff Calculator with your real balances — seeing your exact payoff date and interest saved under each method makes the decision obvious.

    Creating Your Payoff Plan

    A plan you can follow beats a perfect plan you abandon. Build yours in five concrete steps.

    Step 1: List every debt. Write down each card’s balance, APR, and minimum payment. Total the minimums — that is your non-negotiable monthly floor.

    Step 2: Choose your order. Avalanche (highest APR first) or snowball (smallest balance first), as described above. Write the order down; this removes all future decision fatigue.

    Step 3: Set a fixed payment. Add up all your minimums, then add every extra dollar you can find. Be aggressive but honest — the payment must survive real life. A useful target: the fixed payment should be at least 2–3 times your total minimums if possible.

    Step 4: Find the money. Look at three months of bank statements and flag recurring spending that does not improve your life: subscriptions you forgot, dining out that became a habit, impulse purchases. Redirect that spending to the fixed payment before it can evaporate. Even $100 a month redirected from low-value spending can cut a payoff timeline nearly in half.

    Step 5: Automate and isolate. Set automatic payments for the fixed amount on payday, and stop adding new charges to the cards you are paying down. Paying $300 a month while charging $200 is treading water — the plan only works if the balances move in one direction. Keep one card for genuine essentials if you must, and pay it in full each month.

    Credit Card Payoff Calculator

    See how long a balance takes to clear and how much interest you will pay.

    Your result

    Formula

    Each month, interest is charged on the remaining balance (balance x APR / 12) and the rest of your payment reduces the balance.

    How to use this calculator

    Enter your balance, APR and the fixed amount you can pay each month.

    Worked example

    Example: €6,500 at 24.99% APR paying €250/month takes 38 months and costs €2,957.47 in interest.

    Frequently asked questions

    What if my payment is too small?If it does not cover the first month\u2019s interest, the balance never falls — the calculator will warn you.
    Should I pay more than the minimum?Yes. Minimum payments are designed to keep balances alive for years; a fixed higher payment clears them far faster.

    Negotiating Lower Rates

    When you are trying to pay off credit card debt, your interest rate is more negotiable than most people realize. Card issuers would rather lower your rate than watch you default or transfer the balance to a competitor, so a simple phone call can save hundreds of dollars.

    Before you call, know your numbers: your current APR, your payment history, and the competing offers you have received or seen. Then call the number on the back of the card and use a direct script: you have been a customer for several years, you always pay on time, you have received lower-rate offers elsewhere, and you would like a rate reduction to keep the account with them. If the first representative cannot help, politely ask for a supervisor or the retention department — they have more authority.

    If a rate cut is not available, ask about a hardship program. Most major issuers offer temporary programs that lower your APR and waive fees for 6–12 months if you are struggling. These programs may require closing the card, which is often a fair trade when you are focused on payoff rather than new borrowing. Nonprofit credit counseling agencies can also negotiate reduced rates on your behalf through a debt management plan — look for agencies affiliated with the National Foundation for Credit Counseling rather than for-profit “debt relief” companies that charge heavy fees.

    Balance Transfers

    A balance transfer moves debt from a high-rate card to a new card offering a 0% introductory APR, typically for 12–21 months. Used correctly, it is one of the fastest ways to pay off credit card debt, because every dollar of your payment goes to principal during the promotional period instead of being eaten by interest.

    The math, however, includes a transfer fee — usually 3–5% of the moved balance. Transferring $5,000 with a 3% fee costs $150 upfront. That is still far cheaper than paying 24% APR for a year, but you must factor it in. Divide the total (balance plus fee) by the number of promotional months: $5,150 over 18 months means you need to pay about $286 a month to be debt-free before the promo expires. Set up that automatic payment on day one.

    Watch the pitfalls. If the balance is not cleared when the intro period ends, the remaining amount jumps to the card’s regular rate — often above 25%. New purchases on the transfer card usually do not get the 0% rate, so do not use it for spending. And opening a new card creates a hard inquiry and lowers your average account age, a small temporary ding to your credit score. A balance transfer is a tool for executing a plan you already have, not a substitute for one. For independent, step-by-step guidance on dealing with problem debt, the Federal Trade Commission’s guide to getting out of debt is a trustworthy starting point.

    Staying Debt-Free

    Paying off the last card feels like the finish line, but the real victory is never going back. Debt recurs when life surprises you and credit is the only cushion, so your post-payoff system needs to replace credit with cash buffers and better defaults.

    First, build a starter emergency fund of $1,000, then grow it to one month of expenses, and eventually three. Park it in a separate savings account so it is available for true emergencies but not tempting for daily spending. This fund is what breaks the cycle of putting car repairs and medical bills on a card.

    Second, keep the automation you built during payoff, but redirect it: the fixed payment you were sending to the card now goes to savings or investments. You have already proven you can live without that money, so capture it before lifestyle creep does.

    Third, change how you use cards. If you keep a rewards card, charge only what you would buy anyway and pay the statement balance in full every month — never carry a balance to “build credit,” because carrying a balance does not help your score and costs you interest. Review statements monthly, keep utilization below 30% of your limits (below 10% is even better for your score), and keep your oldest card open to preserve your credit history length.

    Common Mistakes

    Even motivated people sabotage their efforts to pay off credit card debt with a handful of predictable errors. Avoid these and your plan will work dramatically better.

    Paying only minimums while “hoping.” Hope is not a strategy. Without a fixed payment above the minimum, a large balance can take decades to clear.

    Closing old cards immediately. Closing a card reduces your total available credit, which spikes your utilization ratio and can shorten your credit history — both hurt your score. Keep old, no-fee cards open with a small recurring charge paid in full.

    Taking cash advances. Cash advances carry higher APRs than purchases, start accruing interest instantly with no grace period, and add upfront fees. They are among the most expensive ways to borrow.

    Transferring balances without a payoff deadline. A 0% offer only helps if you divide the balance by the promo months and automate that payment. Otherwise the debt simply relocates and then reprices higher.

    Draining retirement savings to pay cards. Raiding a 401(k) triggers taxes and penalties and destroys compounding that you can never recover. Almost never worth it — explore every other option first.

    Ignoring the spending that created the debt. The math fixes the balance; only changed habits fix the cause. Track spending for at least three months during payoff so the leaks stay visible. The Consumer Financial Protection Bureau’s Ask CFPB resource answers hundreds of common questions about cards, debt collection, and your rights.

    FAQ

    What is the fastest way to pay off credit card debt?

    Pay a fixed amount well above the minimum every month, target the highest-APR balance first (avalanche), and stop adding new charges. Reducing your interest rate through negotiation or a balance transfer accelerates it further. Most people who switch from minimums to a fixed payment cut their payoff time by more than half.

    Should I use the avalanche or snowball method?

    Use the avalanche (highest APR first) to minimize total interest and finish fastest mathematically. Use the snowball (smallest balance first) if you need early wins to stay motivated. When rates are similar, the difference is small — pick the one you will actually stick with.

    How much should I pay each month toward credit card debt?

    At minimum, every card’s minimum payment to avoid fees and penalty rates. Beyond that, pay the largest fixed amount your budget can sustain — ideally 2–3 times your total minimums. Run your numbers through a payoff calculator to see exactly how each extra $50 changes your debt-free date.

    Will paying off credit cards hurt my credit score?

    No — it helps. Paying down balances lowers your credit utilization ratio, which is a major scoring factor, and a history of on-time payments strengthens your file. Your score may dip slightly if you close old cards, so keep no-fee cards open after payoff.

    Should I take a personal loan to pay off credit card debt?

    It can make sense if the loan’s APR is clearly lower than your cards’ rates and the monthly payment fits your budget — this is called debt consolidation. But it only works if you stop using the cards; otherwise you end up with the loan plus new card balances. Compare the total cost, not just the monthly payment.

    Is a balance transfer worth it?

    Yes, when you have a concrete plan: transfer fee of 3–5% included, total divided by the promotional months, automatic payments set, and no new spending on the card. Without that plan, the debt usually survives past the promo period and reprices at a high regular APR.

    Can I really negotiate my credit card interest rate?

    Often, yes. Issuers regularly grant reductions to customers with good payment histories — a polite call citing competing offers is all it takes in many cases. If they refuse, ask about hardship programs or work with a nonprofit credit counselor.

    What if I can only afford the minimum payments?

    First, make sure every minimum is automated so you avoid fees and penalty APRs. Then look for even small increases — selling unused items, a few overtime hours, or pausing subscriptions can free $50–100 a month, which compounds powerfully against high-rate debt. If minimums themselves are unaffordable, contact a nonprofit credit counseling agency before you start missing payments. For a broader view of structured borrowing costs, see our guide on loan EMI explained.

    Key Takeaways

    • To pay off credit card debt faster, replace minimum payments with a fixed monthly payment you automate on payday.
    • Avalanche (highest APR first) costs the least; snowball (smallest balance first) delivers faster psychological wins — both beat minimums by years.
    • Negotiate your APR, consider a 0% balance transfer with a strict payoff deadline, and factor in transfer fees.
    • Stop new charges on cards you are paying down, or the balances will never move in one direction.
    • After payoff, redirect the payment to an emergency fund and savings so debt never returns.

    Final Thoughts

    Credit card debt feels overwhelming because the statements are designed to make it look manageable — but once you see the real numbers, the path to pay off credit card debt is clear. List your debts, pick your order, set a fixed payment, cut your rate wherever you can, and automate everything. Then plug your numbers into the Credit Card Payoff Calculator to get your personal debt-free date. That date, written down and worked toward every month, is how balances finally reach zero — and stay there.